Freya Ludwig · 15 October 2026
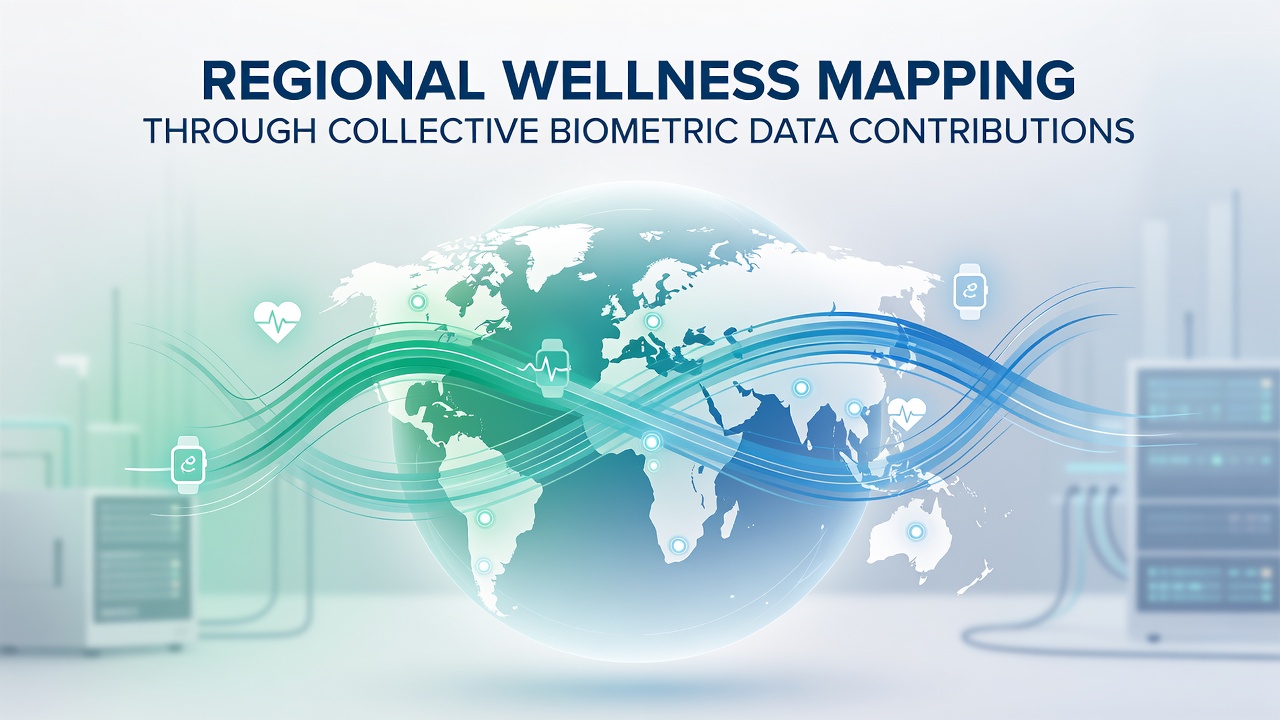
Regional Wellness Mapping Through Collective Biometric Data Contributions
Regional wellness mapping draws on aggregated biometric inputs from wearable devices and portable sensors to track population-level health indicators across defined geographic zones, and researchers compile heart rate variability, activity levels, sleep patterns, and respiratory metrics into layered spatial models that reveal trends without exposing individual identities.
Data aggregation protocols strip personal identifiers before analysis begins, while encryption standards ensure contributions remain secure during transmission from user devices to central repositories, and this process allows health authorities to identify clusters of elevated stress indicators or reduced physical activity in specific districts.
Data Sources and Collection Methods
Participants upload readings through mobile applications that connect to fitness trackers and medical-grade monitors, and studies indicate that voluntary programs in North America and Europe have gathered millions of data points monthly since 2024. Public health agencies coordinate with technology firms to standardize formats, which enables cross-platform compatibility and reduces gaps in coverage for rural communities. According to the Centers for Disease Control and Prevention, such datasets have supported targeted interventions in urban centers where activity metrics dipped below regional averages.
Hardware improvements in compact sensors have increased sampling frequency, while software algorithms filter noise from environmental factors like temperature fluctuations that might otherwise skew readings. Those who manage the repositories apply differential privacy techniques to maintain utility for mapping purposes without compromising contributor anonymity.
Mapping Techniques and Analytical Tools
Geographic information systems overlay biometric summaries onto demographic and environmental layers, and analysts generate heat maps that highlight areas with higher average resting heart rates or lower daily step counts. Machine learning models process these inputs to forecast seasonal wellness shifts, such as increased sedentary behavior during winter months in northern latitudes.
European Centre for Disease Prevention and Control reports document how similar approaches in member states have correlated biometric clusters with air quality indices, and the resulting visualizations guide resource allocation for community wellness programs. Real-time dashboards update as new contributions arrive, which allows officials to monitor responses to public health campaigns within weeks rather than quarters.

Implementation Across Different Regions
North American initiatives focus on metropolitan areas where device penetration rates exceed 40 percent of adults, and Canadian provinces have integrated provincial health records with anonymized biometric streams to refine chronic disease prevention strategies. In Asia-Pacific regions, pilot projects launched in 2025 combined urban sensor networks with citizen contributions, producing maps that flagged neighborhoods experiencing elevated fatigue indicators during high-pollution periods.
Australian health departments have tested cross-border data sharing agreements that align with privacy regulations, and outcomes show improved accuracy in identifying at-risk populations when multiple jurisdictions pool compatible datasets. October 2026 updates from several ongoing trials revealed that refined calibration methods reduced mapping errors by measurable margins in both coastal and inland zones.
Privacy Frameworks and Regulatory Context
Regulations require explicit consent for data use beyond initial wellness mapping goals, and organizations must publish transparency reports detailing how contributions influence public decisions. Independent audits verify compliance with standards that limit retention periods and restrict access to authorized personnel only. Those overseeing the systems employ blockchain-based logging in select projects to create immutable records of data handling steps.
International coordination bodies facilitate knowledge exchange between programs, which helps standardize ethical review processes across borders while respecting local legal variations. Evidence from completed audits confirms that well-designed frameworks sustain high participation rates because contributors receive clear summaries of how their inputs support community-level insights.
Conclusion
Regional wellness mapping through collective biometric data contributions continues to expand as sensor technology advances and participation grows, and the resulting spatial models provide health authorities with granular views of population trends that support evidence-based planning. Continued refinement of privacy protections and analytical methods will determine how widely these approaches scale in coming years, while ongoing trials in multiple continents supply practical benchmarks for future deployments.